
Sustainability
Sustainability Reporting Built on Data You Can Defend
We make each figure traceable to its source and method, connect the data to your operations, and leave you with a system that makes each year's report easier than the last.
Our Point of View
A sustainability claim is as strong as the number behind it, so we treat reporting as a data problem first. Clear, traceable figures then make the communication straightforward.

The Situation
Customers, investors and regulators increasingly ask for sustainability figures, and in most companies the underlying data sits in utility bills, supplier emails and spreadsheets. Reports take months to compile, and last year's calculations can be hard to retrace. Reliable figures make commitments credible and show which actions would make a real difference.
Our Approach
We begin with the data. Every figure links to its source and its method, so that a question about it has an answer. The same records then show which plant, route or supplier deserves attention first, which makes the work operational as well as compliant. Because it is a system, the second year is far easier than the first.
What We Deliver
From First Measurement to a Plan With Owners
How We Engage
Your System of Record in Four Weeks
The system of record is set up on your own energy, travel and supplier data within four weeks. A first traceable footprint is planned at eight, because supplier data is often incomplete or late and each method must be written down.
Your Energy and Travel Data
We gather your energy and travel data and establish where each figure comes from.

Expected Outcomes
What Leadership Should Expect to See
Figures That Can Be Followed Back to Source
Auditors and customers can follow each reported number to its source and method, so that every question about it has an answer.
Reporting That Grows Easier Each Year
One system of record replaces months of chasing spreadsheets, so that each year's report builds on the last.
Reductions Tied to Operations
A reduction plan with costs, owners and dates links targets to specific plants, routes and suppliers, so that commitments can be acted upon.


Industries
Where This Work Applies
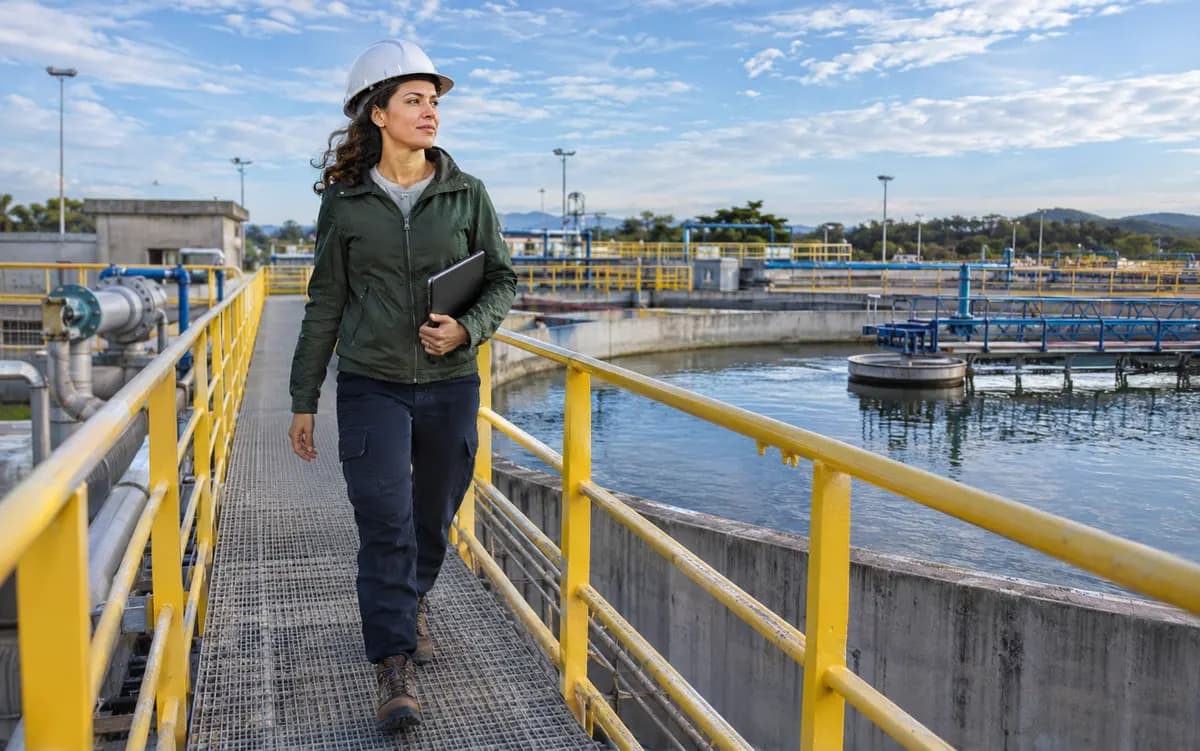
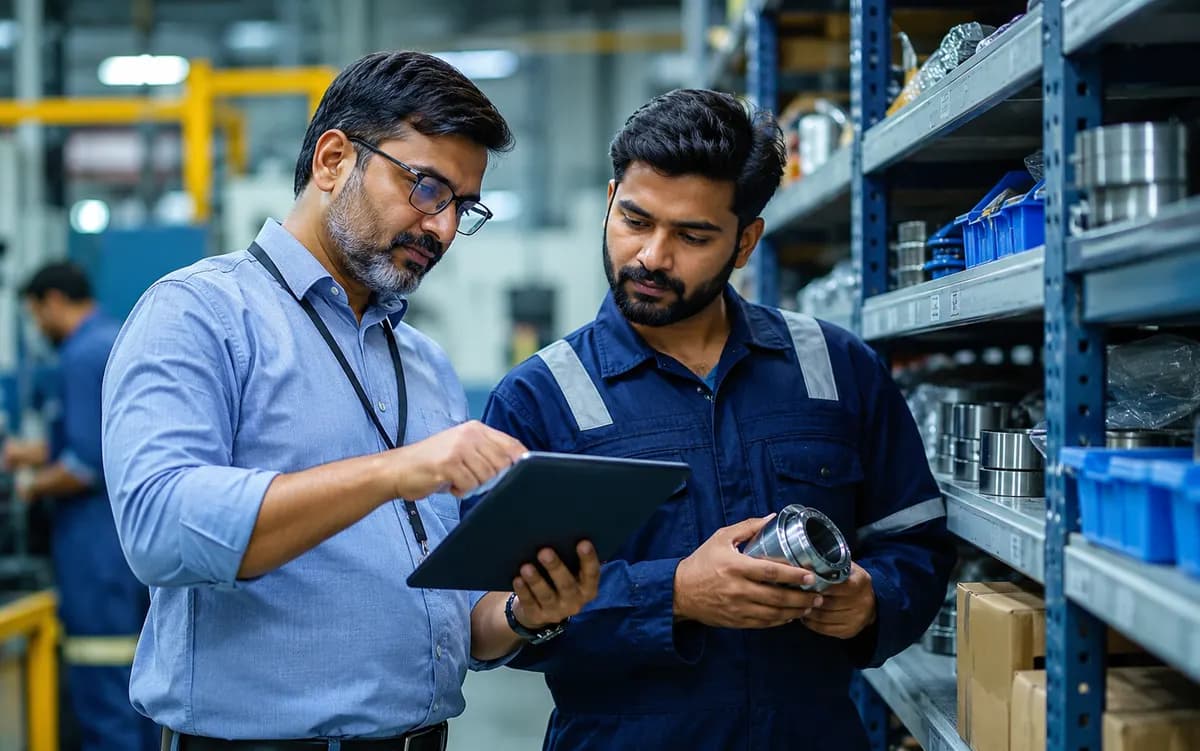
Energy, water, waste and materials data show which plant or process deserves attention first, lowering footprint and operating cost together.
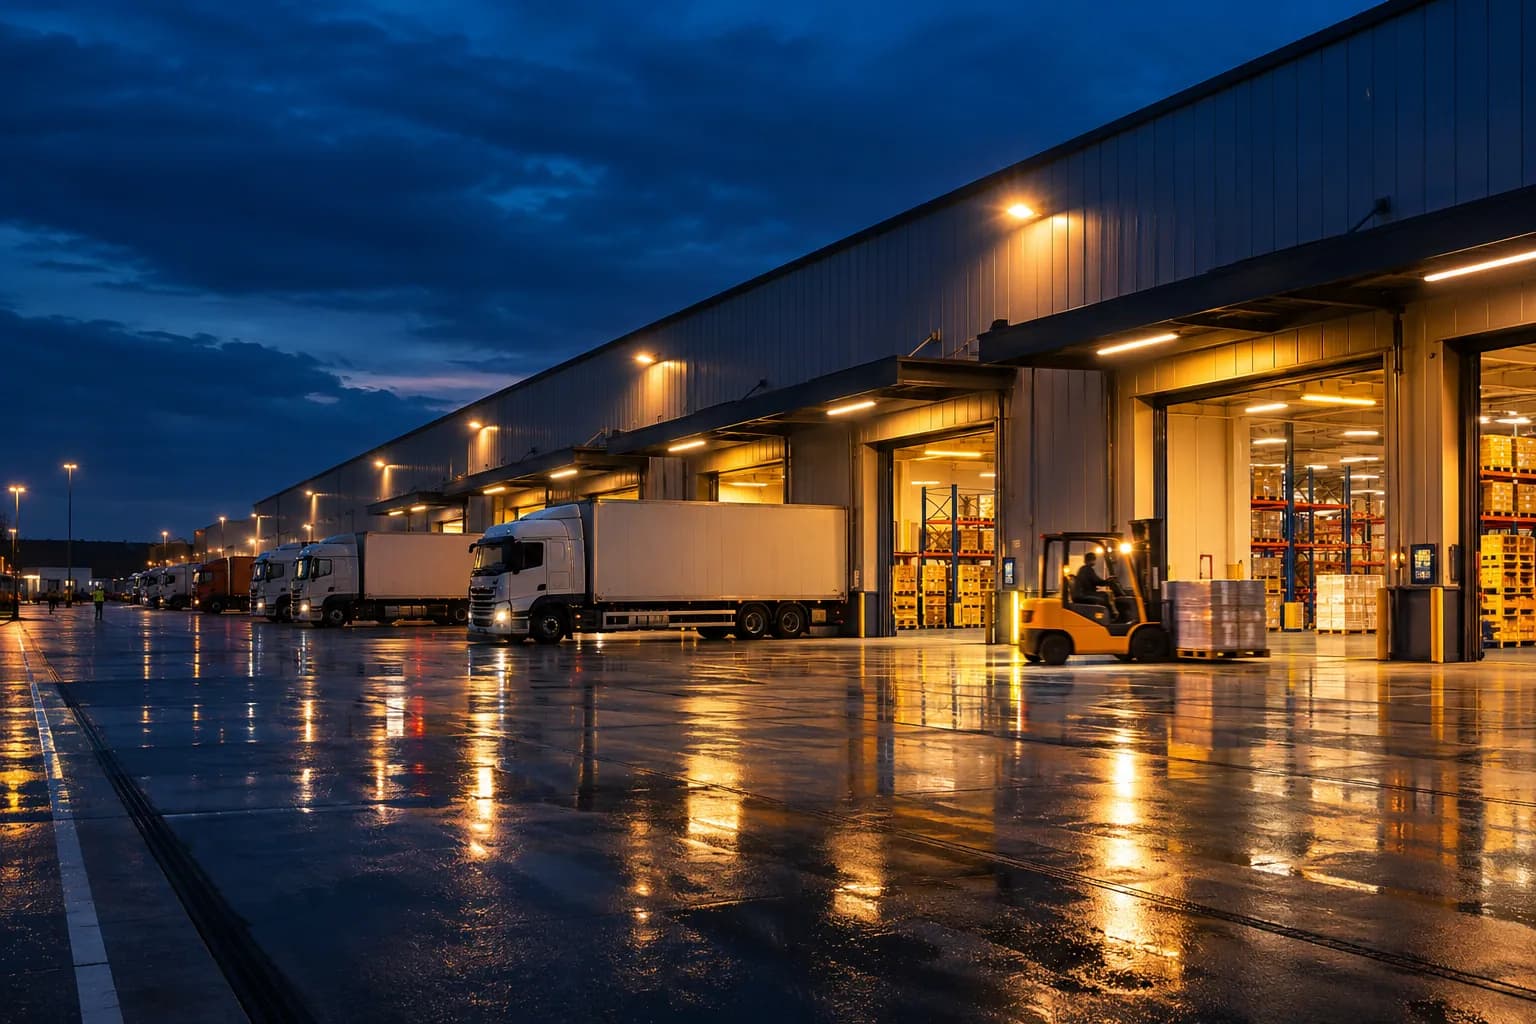
Energy and fuel are usually the largest and simplest sources, so a first traceable inventory starts here and gives regulators and investors figures they can check.
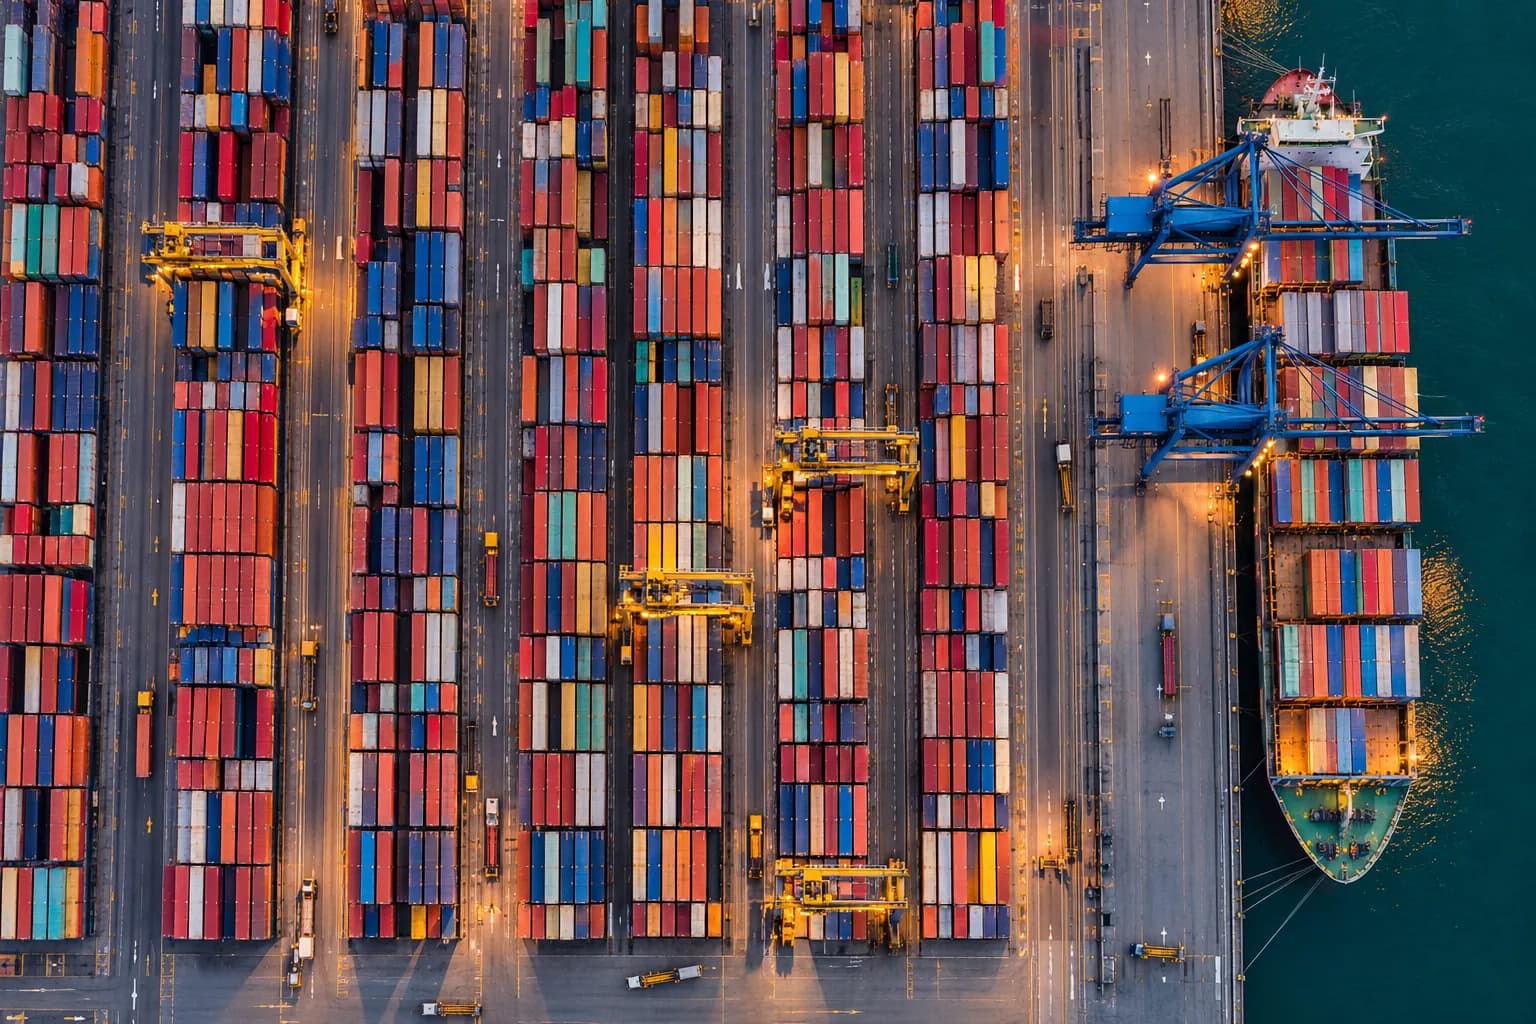
Much of the footprint sits with suppliers, so supplier data is collected consistently to show where the largest impacts lie across products and routes.


Insights
Perspectives on Sustainability Data
Guide · 4-minute read
Treat Verified Emissions Data as an Export Asset Before Your EU Customers Ask
ExpandYour EU customers carry the CBAM duty, and the evidence sits in your plant. We build a system of record in which each figure traces to its source and method.
Guide · 4-minute read
Treat E-Waste as a Data Obligation and Every Figure in Your Return Can Be Traced
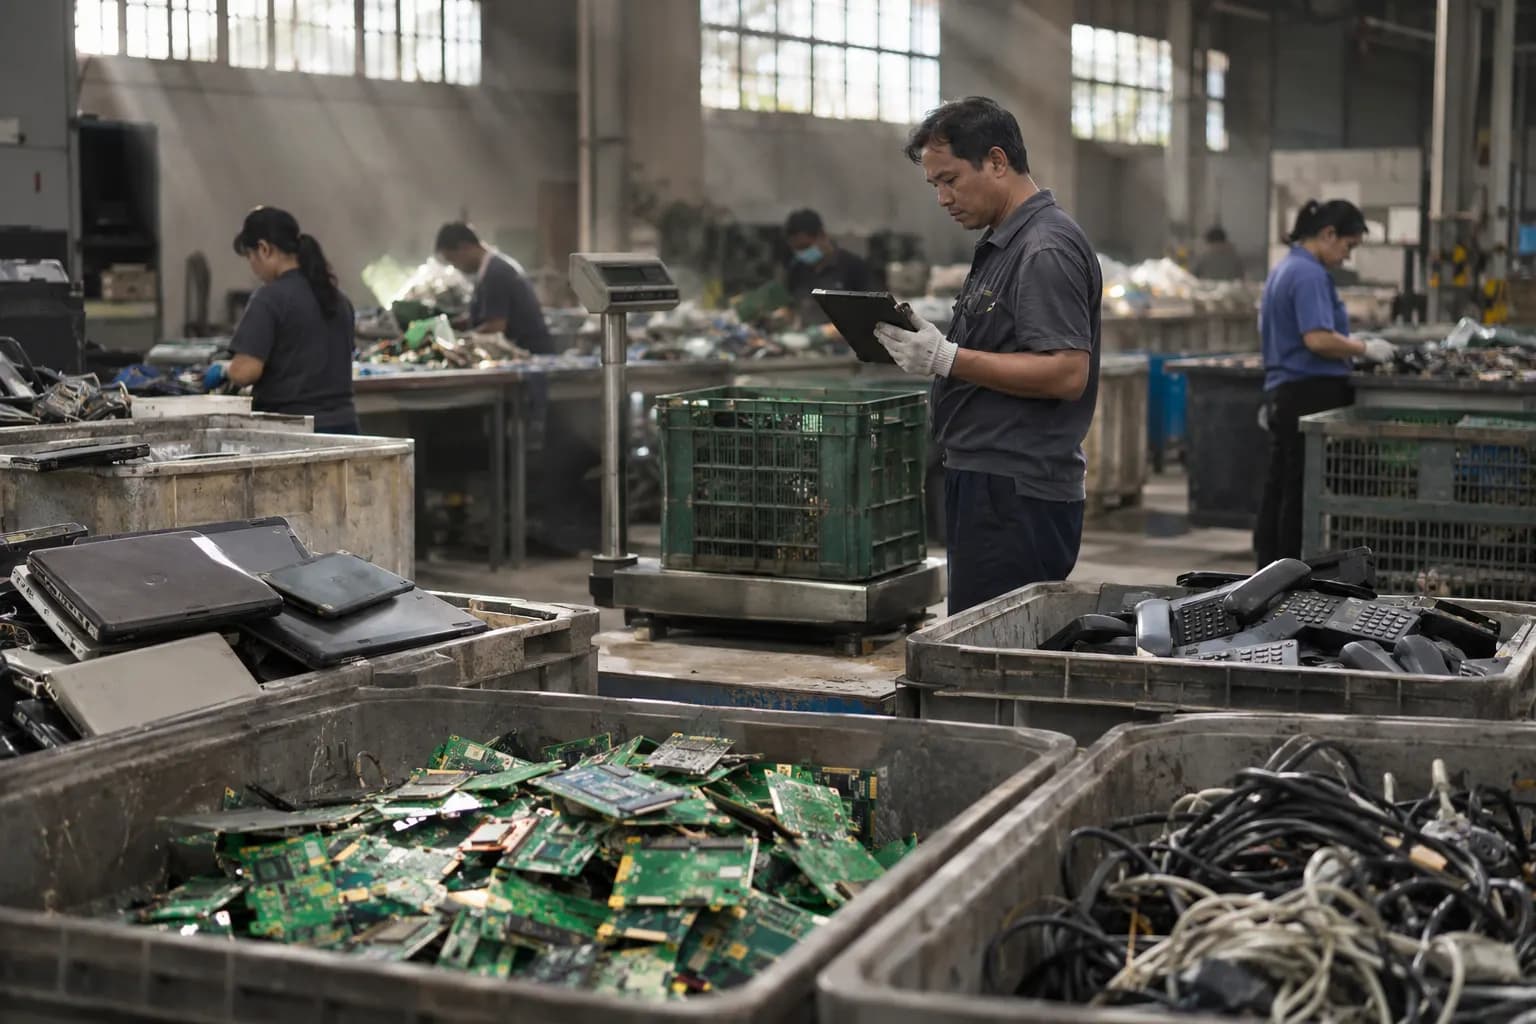
ExpandAn e-waste obligation is calculated from your product and sales records. We map the products, fix the weights and link every figure to its source, so your return can be followed back.
Guide · 4-minute read
Design the Inspection Record and the Defect Closure First, Then the App
ExpandA phone checklist makes the form faster and leaves the defect waiting. We design the record and the closure first, then build an app that works wherever the round goes.
Guide · 4-minute read
Supplier Emissions Data: We Estimate First, Then Ask a Few Suppliers for the Records That Matter
ExpandA questionnaire sent to every supplier produces a large file and little insight. We begin with a rough estimate from your own records, then ask a few suppliers for the plant data that matters most.
Perspective · 4-minute read
Sustainability Figures That Stand Up to an Assessor: We Make Every Number Traceable
ExpandReporting is the easy part. We put your energy, travel and supplier data into one system of record, so any figure can be followed back to its source and its method.


Frequently Asked
Questions From Prospective Clients
We Have Not Measured Any Emissions Yet. Where Do We Begin?
Will the Data Behind Our Report Also Show Where Energy and Materials Are Being Wasted?
How Do You Treat Incomplete Supplier Data in Our First Footprint?
Can Our Auditors Follow a Reported Figure Back to Its Source?
Will This Make Our BRSR Report Easier to Produce?
Will Next Year's Footprint Mean Repeating the Same Exercise?
What Is in Place at Week Four, and What Does Week Eight Add?
Explore Further
Related Services
Business Consulting
Clear direction on what to change first, and a plan with named owners that your people are able to carry out.
Applications
A considered view of the application portfolio, modernised in stages, connected properly and kept running well.
AI and Automation
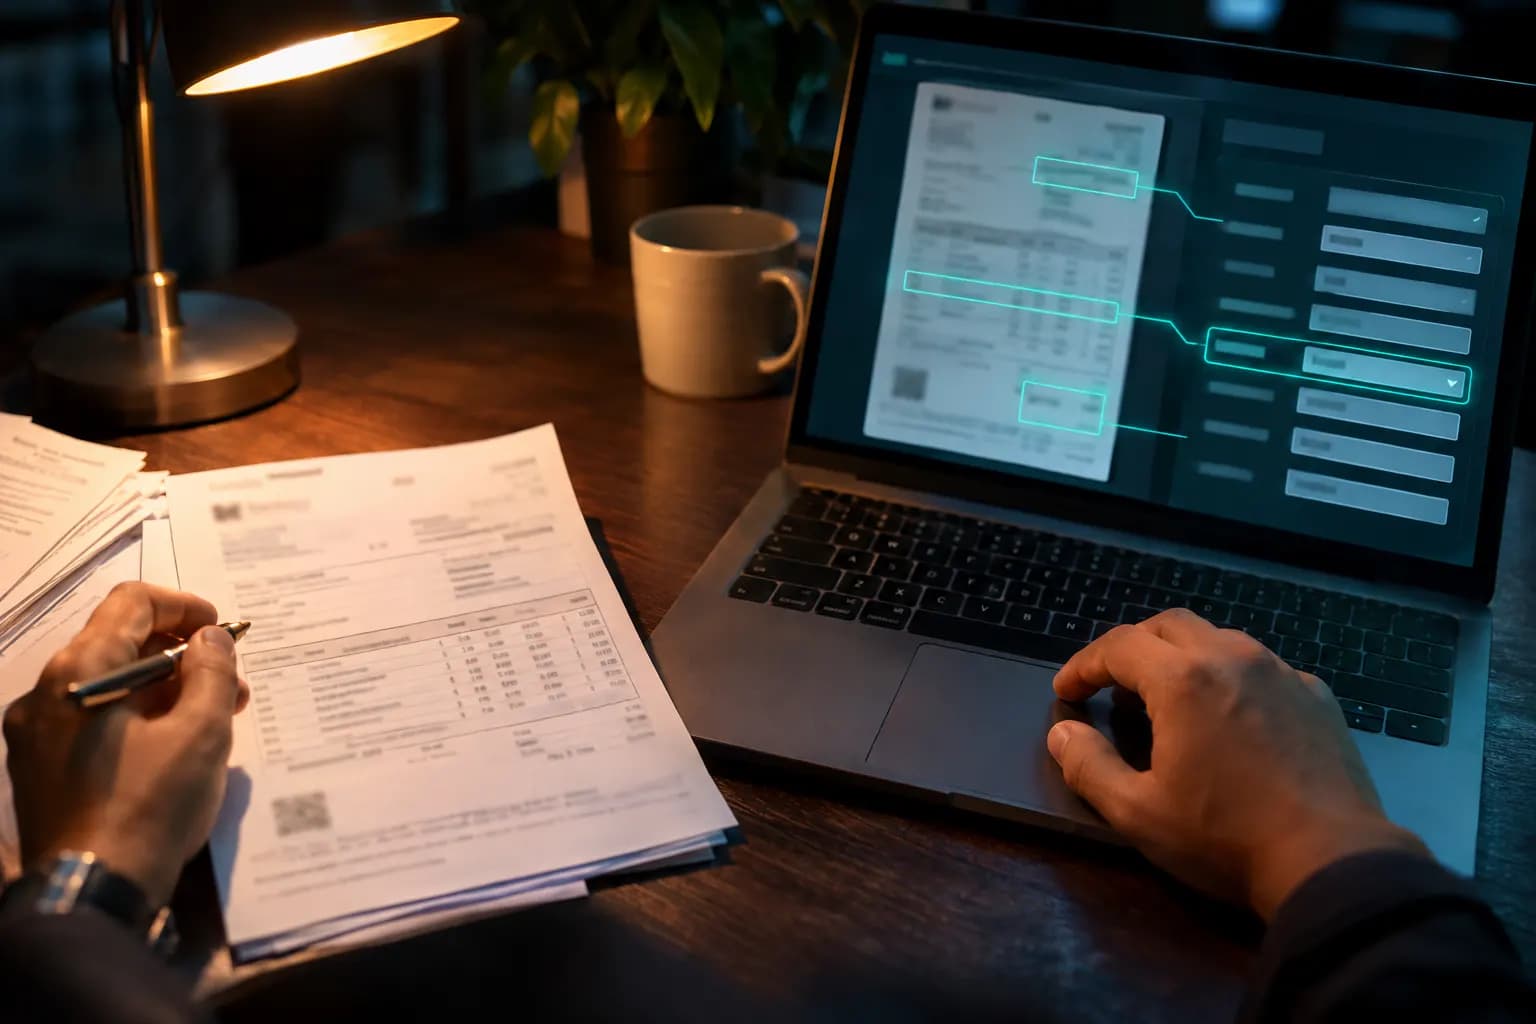
Applied AI for document processing, knowledge and workflow, measured on your own records before it reaches production.


Next Step
Book an Appointment
Arrange a complimentary 30-minute conversation, with no obligation. You will leave with a candid view on whether the initiative is worth building and, if it is, a scope and a date, with the cost worked out together on the call. Alternatively, send an enquiry and we will respond.